Danish Wind energy index ver.13 update (Show as PDF)
By Per Nielsen, EMD International AS, Aalborg, Denmark
From September 2013 the Danish wind energy index has been updated. The basic method is the same as in the previous ver.06; the monthly energy production from a number of WTGs (named reference WTGs) is compared to the same WTGs expected long term average monthly production based on longer production period corrected with index. The relation is:
Formula:
Index = Actual monthly production/long term average AEP/12
The source for production data is the utility based data for all Danish WTGs on a monthly basis from 2002 and forward, which is updated each month. The data is published by the Danish Energy Agency at www.ens.dk. Annual data is available back to 1977, but not accurate for all turbines in the early years (estimated values).
The version 13 headlines:
A trending due to degradation in turbine performance has been discovered. The ver.13 index is adjusted for this with +0.4% per year 2002-12.
The WTGs used in calculation (reference group) have been updated by taken out the oldest and include new (see details in text).
The new long term reference period (100%) is 1993-2012 based on Merra model data. This increase the general index level by 2%.
The base increase of 2% + 0.4% per year 2002-12 give an average increase in index of 4%, meaning that the long term production expectations for the turbines shall be reduced by 4%. However, for installations in recent years the reductions can be up to 8% relative to using the ver.06 index for the long term correction.
Some important technical information to the index:
The long term level of a wind index shall be 100%, and it shall represent the available wind energy seen from a wind turbine. For defining the long term period, there are no unique definitions. Metrological long term periods are normally 30 years. However, we do not have a 30 year period with the same turbines operating. Further, the technology change over time also makes it difficult to create a perfect index. Finally, the newly discovered degradation of the turbine performance over time makes it even more complicated to establish the perfect index. Therefore, a revision from time to time will be needed.
In this revision we have decided to use 1993-2012 as the 100% period, and base it on MERRA data, which we have found to represent the long term variations quite well.
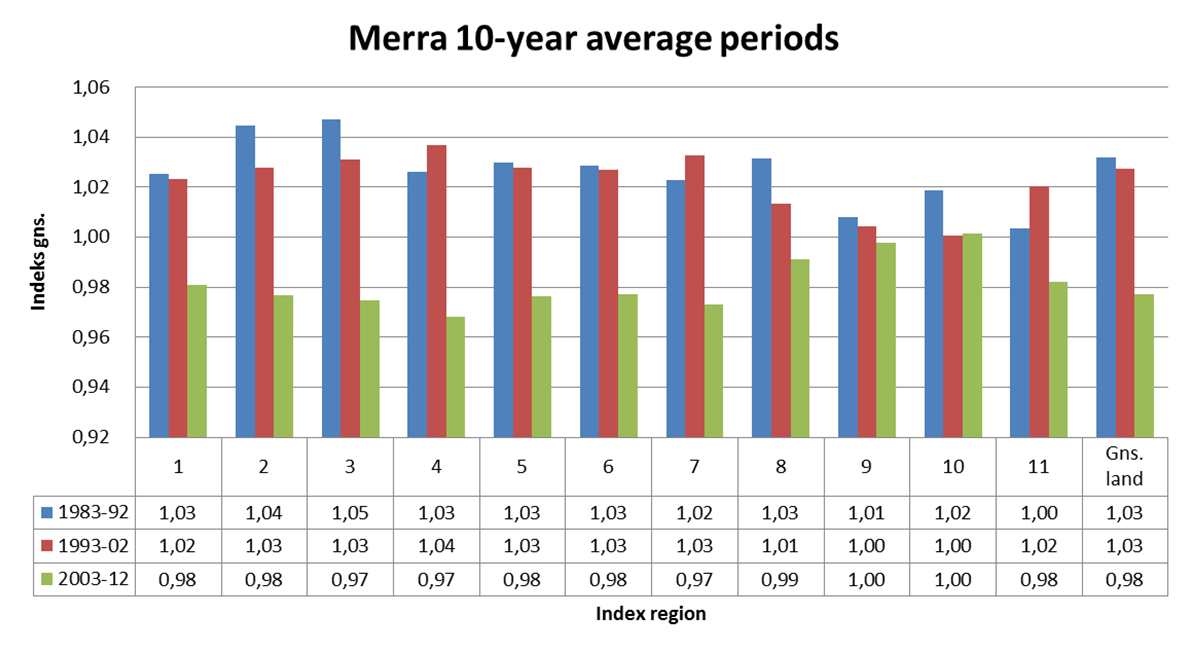
The last 30y Merra for the 11 DK index regions. We see two high wind 10 year periods and one low wind 10 year period. Particulary for the onshore regions 1-8 whereas the offshore regions 9-11 have less variations.
No doubt that, e.g. based on NAO index (North Atlantic Oscillation), the mid 80ies to the mid 90ies were unusual seen in a 150 year perspective. Therefore, this period should not be given too much weight. Having two high wind periods and one low, makes it logical only to use one high wind period and one low wind period to form the long term basis.
The data with additional comments and analyses are available for download at www.vindstat.dk ¢ Please look at the table page and download the excel sheet.
Degradation of the turbines performance
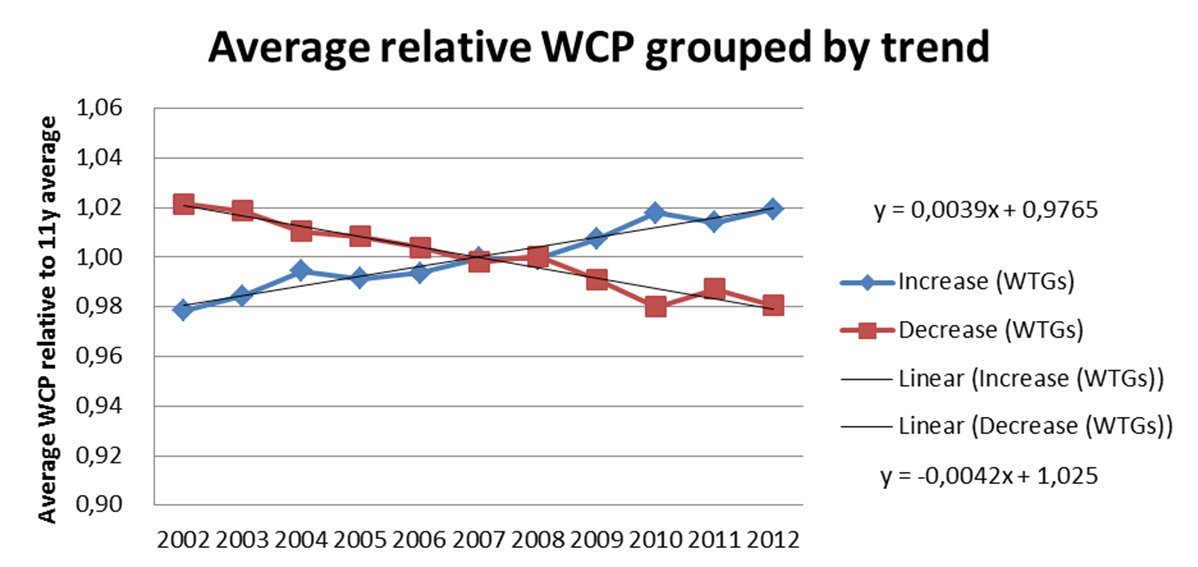
The above figure shows the dividing all turbines from 150-1300 kW into two groups, either with positive and negative slope of the wind index corrected production during the period 2002-12. Both show a very consistent linear up/down going trend. The data is filtered for major availability downtime events, by taking months out where the production was less than 75% of expected.
The annual values is then constructed on basis of the average wind index corrected production for the approved months. At least 10 approved months are required to include the turbine. Only turbines with approved data for all 11 years are included. The sample represents 3,372 turbines. Out of these, 217 turbines showsha no trend based on that a trend shall be seen within 3 decimals for the annual slope.
Basics are that turbines cannot improve performance over time, unless technical improvements are made or the terrain condition improved. This does not apply for DK turbines apart from a very few. Therefore, the turbines with increasing production must represent a bias in wind index. Here two groups represent each half of the turbines. The change in performance for the two groups is round 0.4% per year.
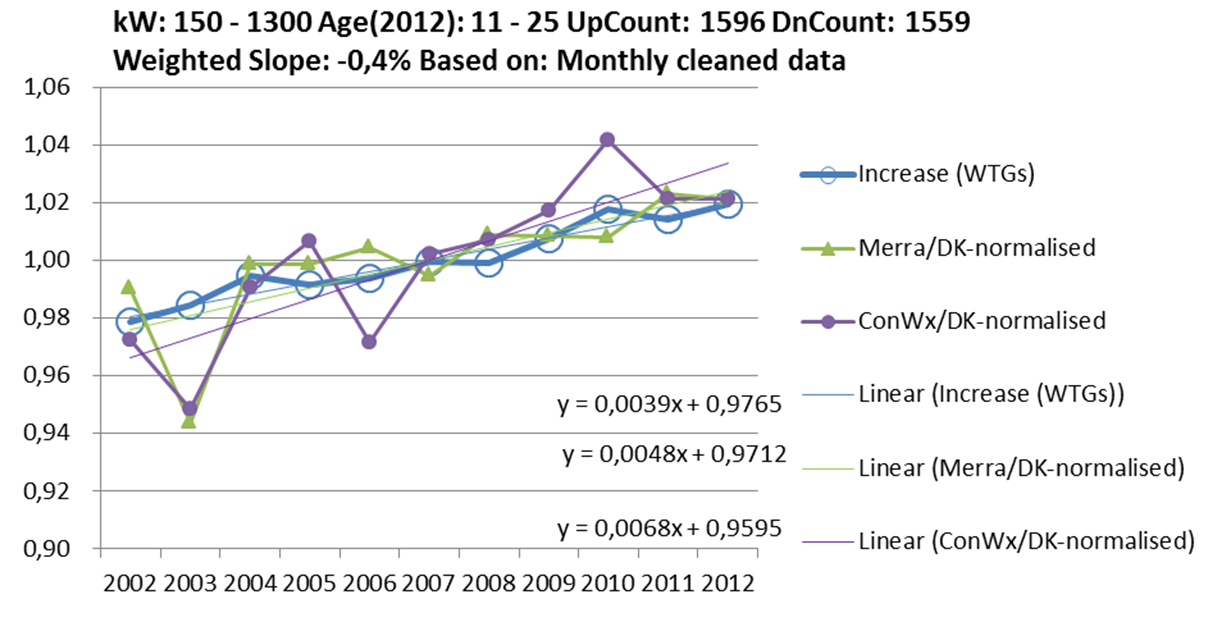
We now compare the half with upgoing trend with model data trends relative to the wind index ver.06. It seem like a ōlucky punchö that there is an exact match between the average of the half that increase and the model data. It is although also seen that the model data are less stable from year to year compared to the turbines, meaning that there is also in future a need for a turbine based index, which especially on monthly level is much more precise than the model data.
Conclusion is that the ōwrong trendö or bias on index is 0.4% per year.
The main reasons for the trend is probably the maintenance level, which decreases by age. But also issues like increased terrain roughness and performance degradation due to e.g. surfaces of the blades play a role.
Establishment of the ver.13 index
Adjustment of ōbasis indexö
The Ver.06 index is adjusted on two levels:
A 0.4% increase per year is multiplied on the Ver.06 index from 2002-12.
The average index for each region is adjusted, so it equals the Merra based index for 2002-12, where the Merra average is 100% for 1993-2012 (recent 20 years).
Calculating the WCP for all turbines based on adjusted index.
The adjusted index is used for finding the long term production (WCP) based on monthly data for 2002-12. This gives the reference production for each WTG, which is basis for generation of a new wind index.
Establishment of a new reference turbine group
In the Ver.06 index, many reference turbines are very old, some up to 23 years, and no turbine is less than 11 years old in 2012, so no wonder some degradation is seen. It is therefore time to modernize the reference group. This is done by following:
Turbines are taken out if:
Standard deviation in the 11y data is higher than 5% on year to year basis.
Decrease is more than 0.5% per year in filtered data.
Established before 1996 (older than 17 y at present (2013).
Smaller than 150 kW (small wind turbines only reports sold production, not production, and is therefore not suited for index generation ¢ and these behave essentially different from larger turbines).
New turbines are included if:
More than 150 kW.
Established before 2011 (leaving at least 2.5 years of operation for establishment of reference production).
Non offshore turbine.
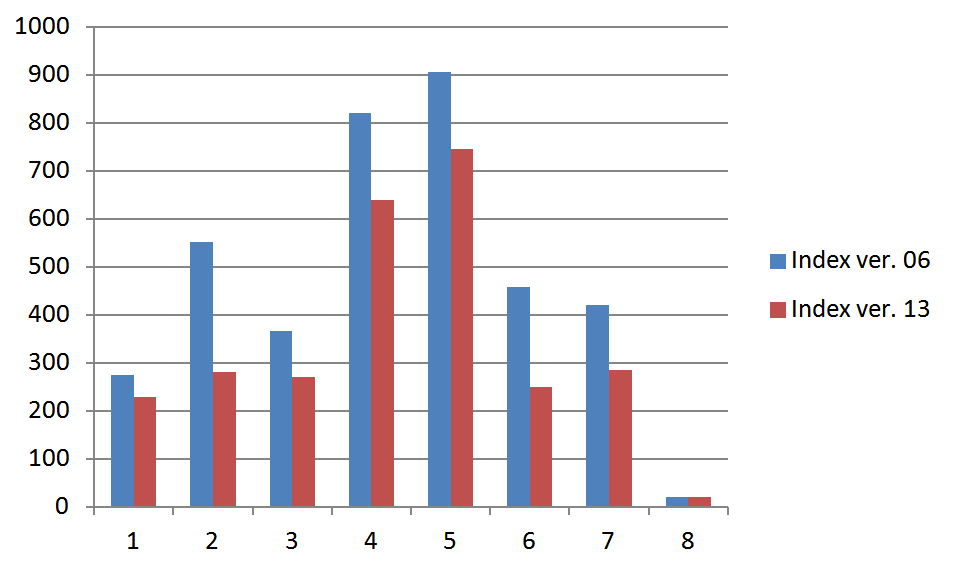
This gives following distribution compared to ver.06 reference turbines:
Number of reference turbines by index region. As seen, many turbines have been taken out in the new wind index.Of the ver.06 reference turbines, many have been taken down today, so the ver.06 numbers refer to what was when the index version was established.
By year of start of operation ¢ Not many very new have been included due to almost no new installations during 2003 to 2008 in Denmark. It is therefore still the 1996-2000 installations which represent the majority of the reference turbines. A few 2002 turbines were included in ver.06 index. These are on the island of Bornholm, which has so few installed that a later add-on of reference turbines were needed.
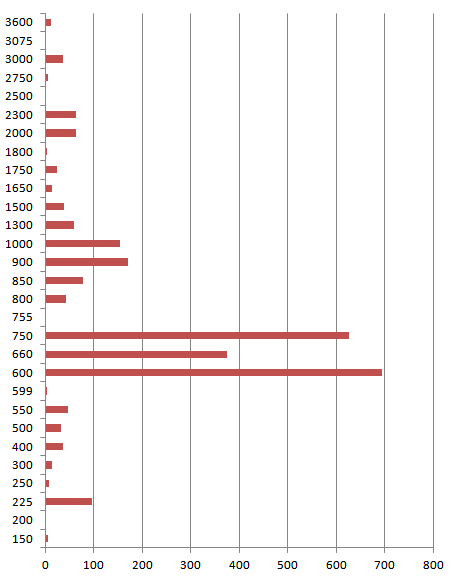
By kW, only ver.13 ¢ Heavily dominated by 600-750 kW turbines, but now also with some larger modern turbines.
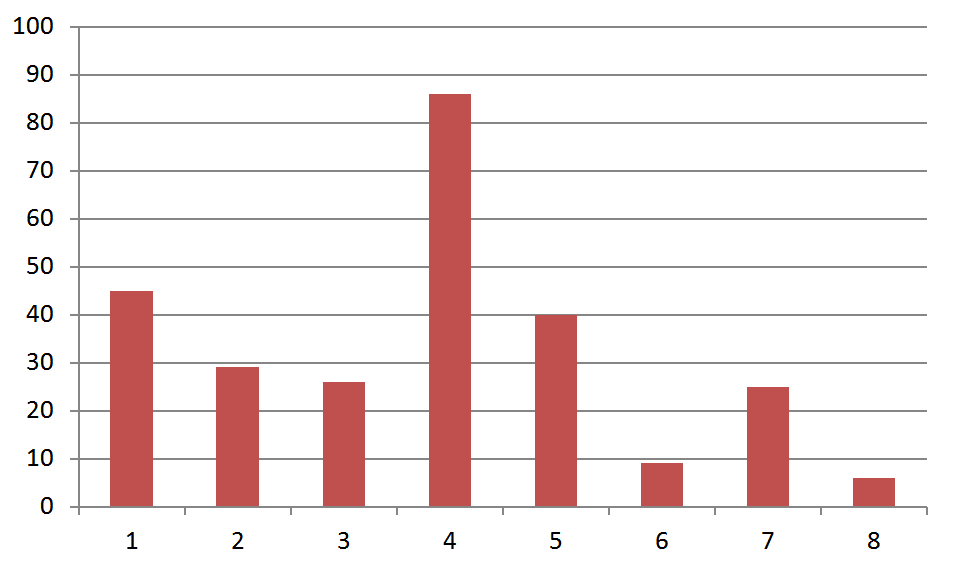
Number of large turbines by region (1500+ kW) - It is our intention to calculate a large turbine index to see how much this will differ from the average. The basis for this is not that large, but at least we can get an idea, and then later include more large turbines.
We ended up with 2,717 reference turbines for the ver.13 index. Ver.06 had 3,813 turbines at the beginning, but several were taken down during the period this reference group was used.
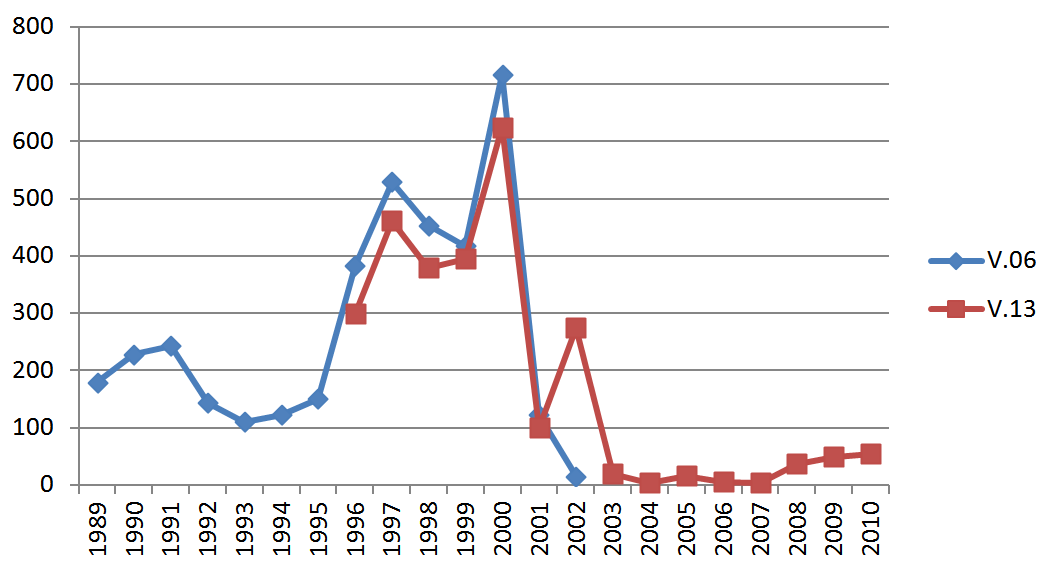
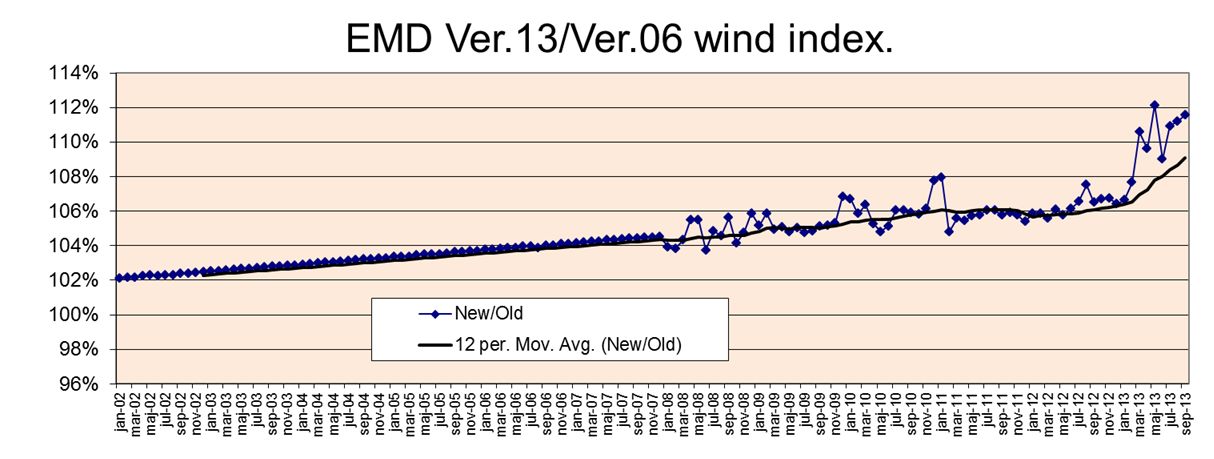
Calculating the ver. 13 index
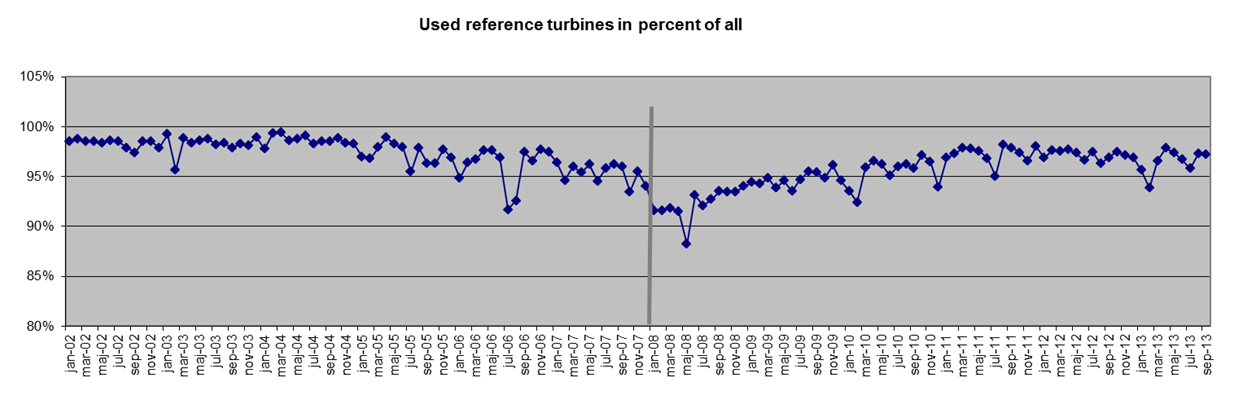
We decided to make a cut at between 2007 and 2008. Before 2008, we used the ver.06 index adjusted as previously described. From 2008, we used the new reference group. In this way we phased in the new reference group, before all the turbines in the reference group became active. The graph illustrates how many of the reference turbines were used month by month. The non-used were either not existing in the given month or dropped due to filtering for availability (25% down relative to expected production).
The resulting ratio between the new and the old index is shown above. In 2002, a general adjustment of 2% due to the new long term reference period is seen. From 2002-07, the 0.4% per year adjustment is shown, and from 2008 the new reference group with newer and larger turbines is taking over. This still as basis increase 0.4% per year, but with some deviations month by month due to the new reference group.
Some might be surprised by the high deviation in the recent 2013 months. The explanation is probably mainly due to the extreme low wind in this period in combination with taking out all the smaller turbines from the old reference group. It is well known that small turbines perform extremely poor at low wind. A turbine operating around 6 m/s due to low hub height and which only get 4.5 m/s one month decreases much more than a turbine going from 8 m/s to 6.5 m/s in a month. This is an essential problem when creating wind indexes during a period with change in turbine sizes.
Another reason is the domination of eastern winds in the period. The new reference group seems to perform better in average by eastern winds, maybe because many small west coast turbines have been taken out of the reference group and the new reference group therefore gives a better geographic representation (see later).
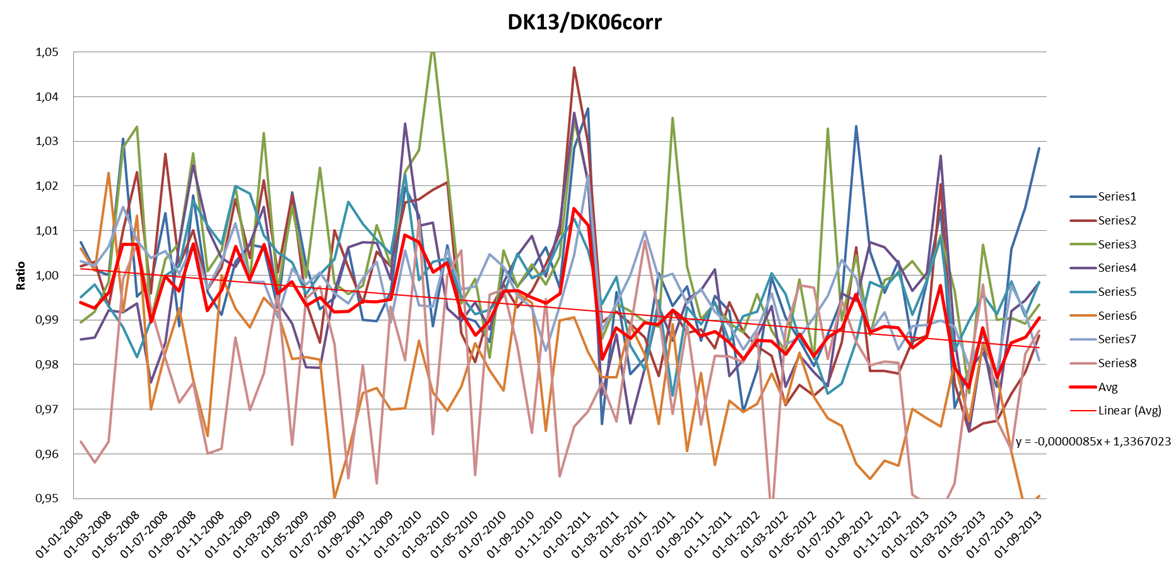
The new reference group still is assuming to have a decrease due to degradation. To find this we have established the relation between new non-adjusted and ver.06 adjusted index:
This graph gives the average trend of the new reference group relative to the adjusted ver.06 index for the period 2008 to Sep.2013. Series1 is index region 1, etc.
As seen the graph has a down going slope, which is expected as the new reference group still consists of a majority of the same turbines as used in the Ver.06 index.
From the graph we can read:
Trend per day:
0,00085%
per year
360
0,30600%
We therefore include a slope of 0.3% per year in the index based on the new reference group. Not surprisingly, the slope is lower in the new reference group as all the oldest turbines and the most de-sloping have been taken out.
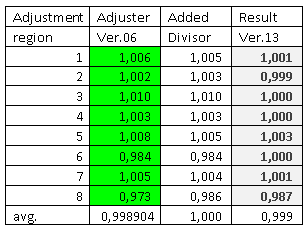
We also adjust the regional corrections to bring all regions at the same level based on 2008 to Sep.2013. In the ver.06 we had adjusters, which we now modify.
ItÆs good to see the new adjusters are very close to 1. So it should be as we have previously adjusted on regional basis to bring regions in line in ver.06 index based on Merra for 2002-12. Only region 8 (Bornholm) has a little adjustment.This is probably due to some manual adjustments made during the years, when the cable to the island were broken and most of the turbines therefore had several months out of operation.
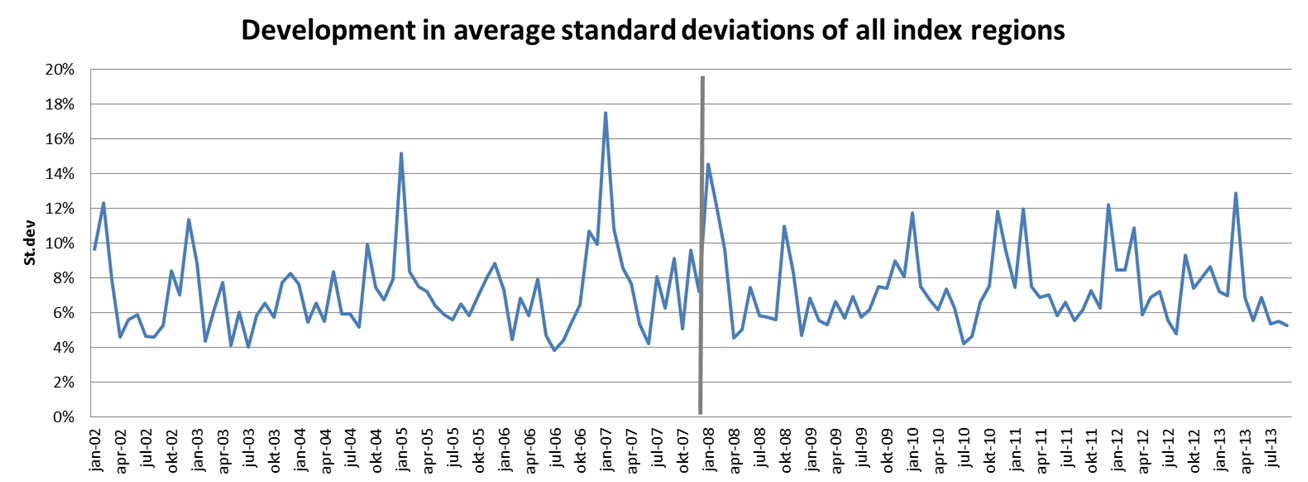
Checking the new ver.13 index
One measure is the standard deviations taken on all reference turbines within each region, then average these for all regions. As seen, no major changes between former and new reference groups, although the latter seems to have smaller high peaks. A high standard deviation can although just mean a uniform wind direction, which gives large deviations between east and west coast turbines.
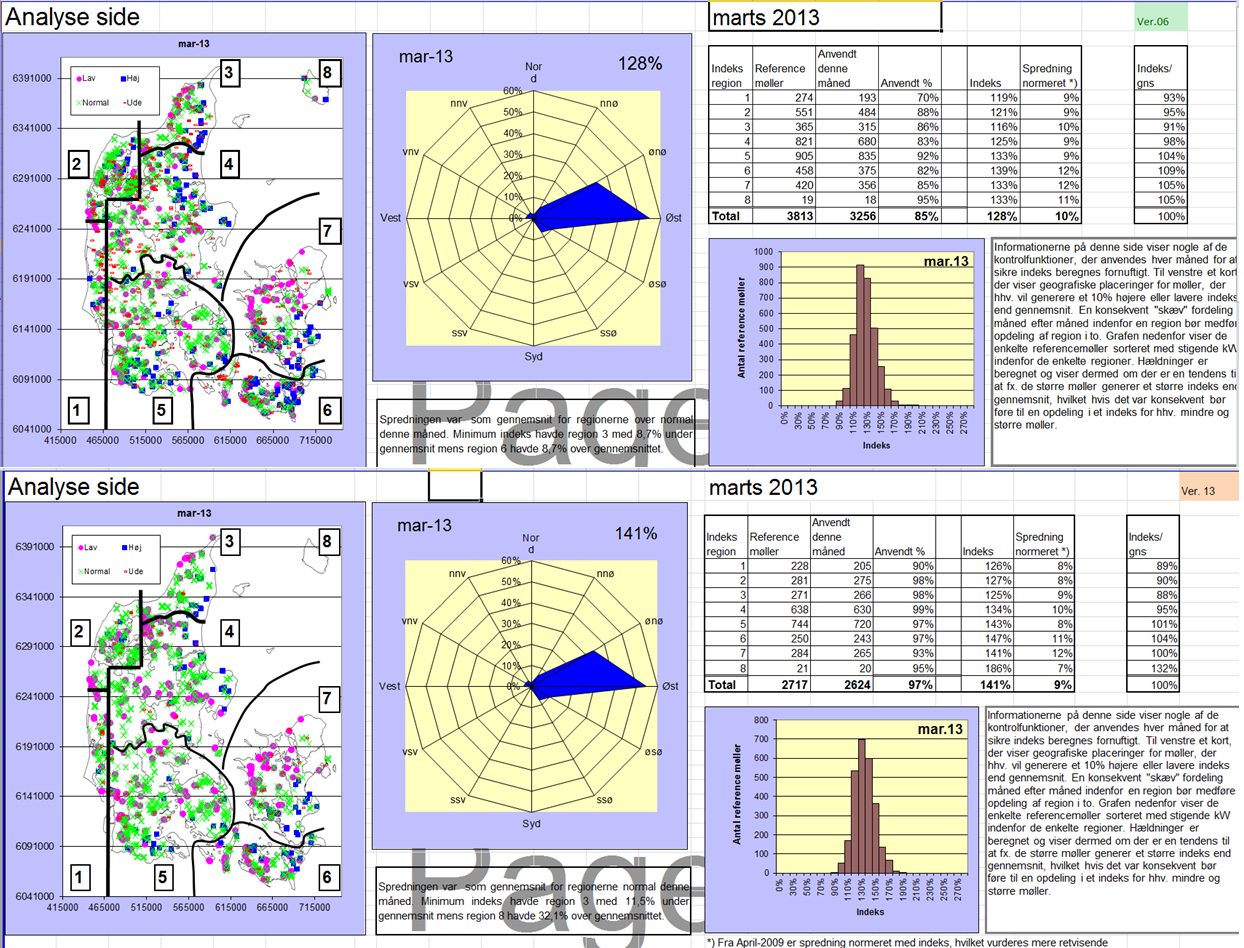
Each month the wind index has been checked by different graphic presentations. The example above show March 2013 for the two index versions, which in spite of a high wind month has a large deviation (11% higher in Ver.13). The reason is probably caused by the abnormal direction distribution in combination with fewer west coast turbines in the new reference group. Note the red and blue dots on map. Red show turbines with more than 8% below average for the region, blue with more than 8% above average for region. Green is within +/- 8% and the red small squares show the filtered turbines below 25% of average. In an east wind month like this, east coast turbines performs of course much better than similar west coast turbines. Such deviations tell that there should always be at least 1 year data included in a follow-up to get a representative direction distribution, before any conclusions can be made.
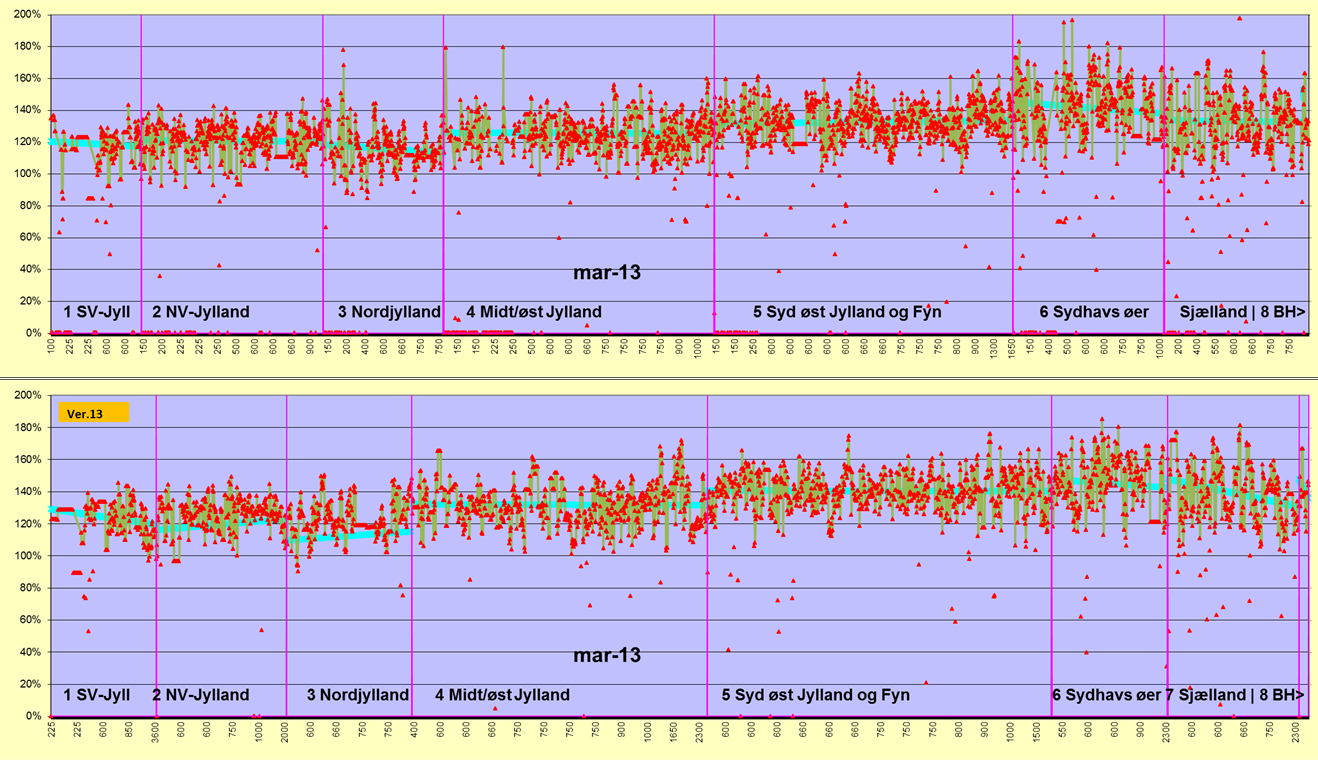
The presentation of index value for each turbine sorted by rated power within each region tells if there is trend issues by size of turbine. It can be seen on the turquise lines (the slope line for each region) that some regions have a down trend, some an up trend by size this month.
We follow these possible trends to judge if like division in an index for smaller vs. larger turbines will be needed. It also shows if the criteria for dropping outliers is reasonable. The red dots not touched by the green line is the dropped data points, where we assume major availability issues is the reason for the low performance the given month.
Comparing the upper (ver.06) to the lower ver. 13, we notice that the slopes seem a little larger in the ver.13, probably due to inclusion of more larger turbines > 1500 kW. This we will follow closely and start making a large turbine index.
Another check is to compare the wind index corrected production turbine by turbine for all months with data for each turbine (not just reference turbines) for the new and former index versions.
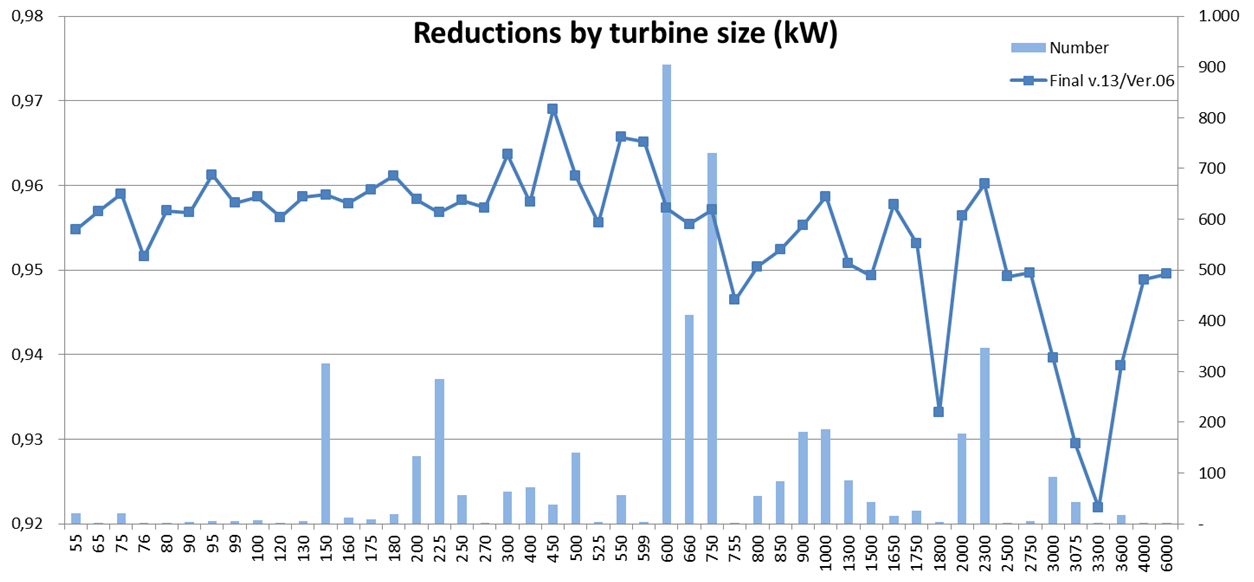
Above graph shows the reductions by turbine size. For most turbine sizes, the expected 4% reduction is seen (average between 2002 and 2012 adjustment). However, for the larger turbines, which mainly just have been operating in the last part of the period, the reductions are higher, up to 7- 8% by kW group ¢ although these groups have very few turbines.
It is observed that the 3075 group (the V112 turbine) gets a reduction in expectations of 7% in average, and that the 3000 and 3600 (mainly recent Siemens turbines, but also V90), get a 6% reduction in long term expectations, with the new index version relatively to the old index. This is also expected as we typically have seen that these turbines perform much above expectations based on what the calculation model predicts.
However, the above observation might not be the ōfull truthö. There can still be a bias as this index is mainly based for 600-750kW turbines, which has lower hub height (45m) than the new 3MW generation (90m), and thereby react differently on high/low wind periods.
We will in near future try to establish a dedicated ōlarge turbineö wind index to put more light on this issue.
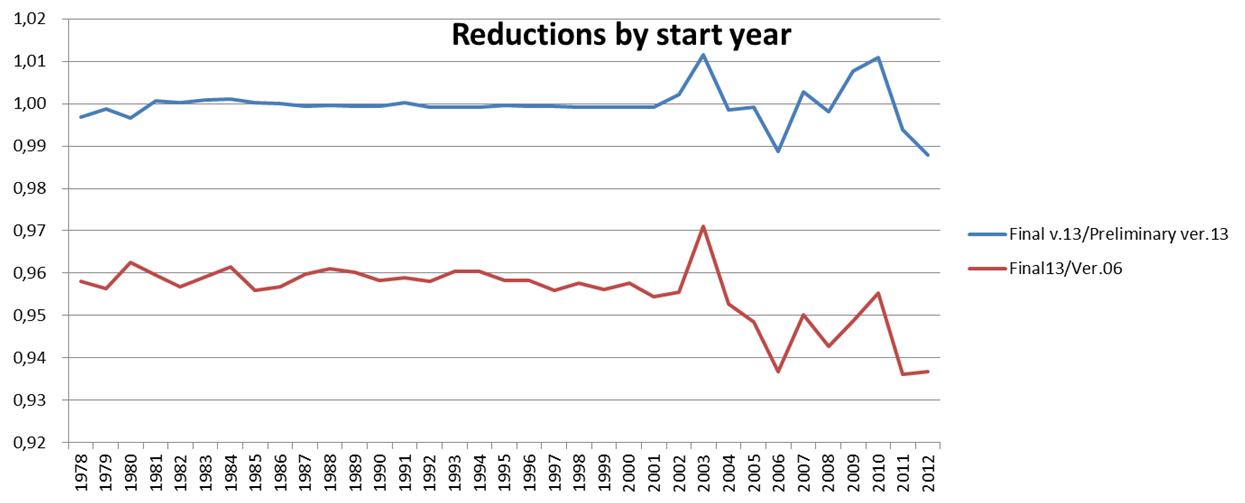
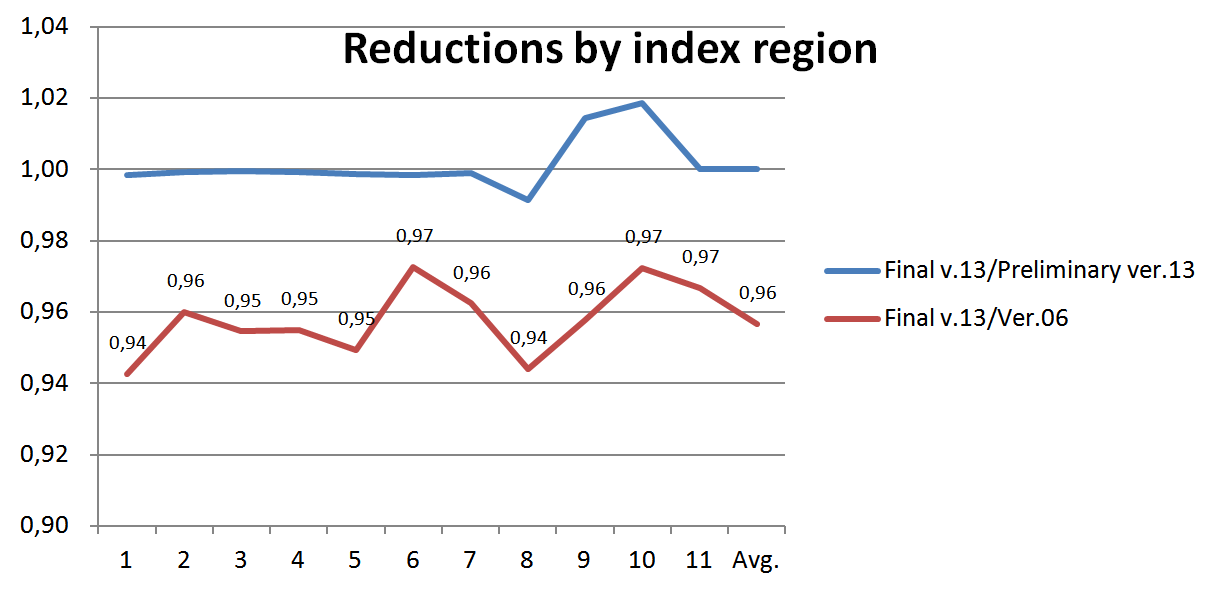
The reductions by start op operation year show similar results. Here we also compare the new ver.13 index with the simple adjusted ver.06 index (preliminary ver.13). As expected, no difference for the older turbines, but some for the ones installed in recent years due to the new reference turbine group. Turbines installed 2011-12 will with the new index have a long term prediction 6% lower than based on ver.06 index in average.
Similar analyses by region. More reduction for region 1 is also as expected ¢ This was one of the regions we were suspicious about with the old index and which partly initiated the process of establishment of a new index version.
Annual values 1983-2001 based on Merra index
In the new index version we have decided to replace old turbine based index figures with Merra based index.
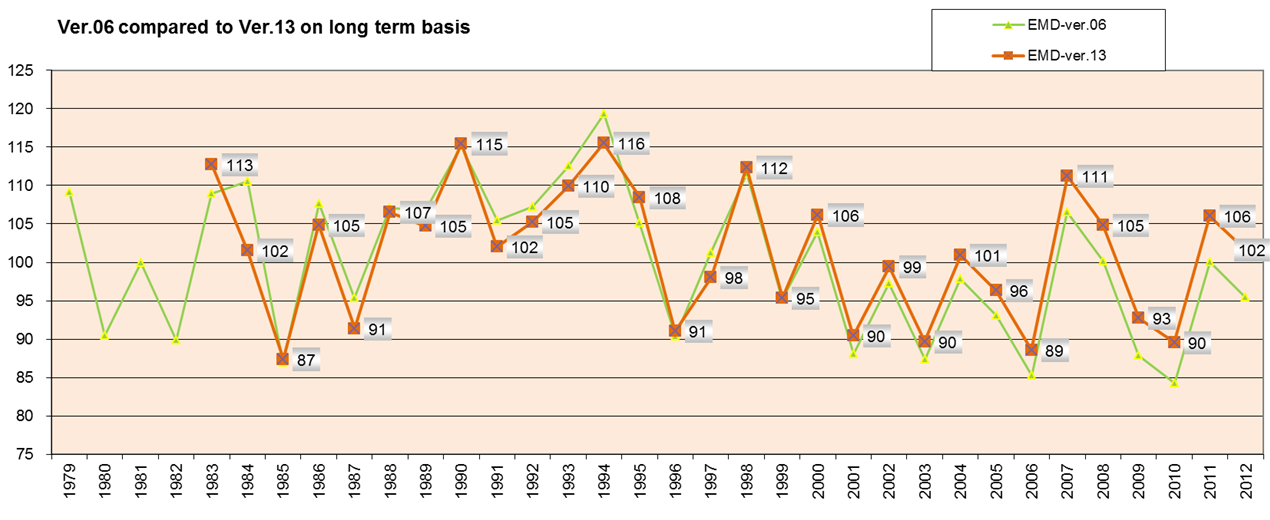
As seen in the graph, the Merra (ver.13) matches the former turbine based ver.06 index reasonable well back in time. It is typically a bit lower in the very high wind periods, like 1991-94, but this can be explained like this: The old small turbines were more sensitive to high wind years and produced very well relative to long term these years, because they had a low hub height and were designed for high wind speeds (small rotor area per kW). Larger turbines would not have produced that much higher relative to their long term production.
The new ver.13 index therefore represents a specific turbine class, 150-1300 kW and a typical hub height of 30-60 m for the whole the long term period whereas the former index versions represented the main stream heights for the given period. This gives higher consistency in the new index version 13.
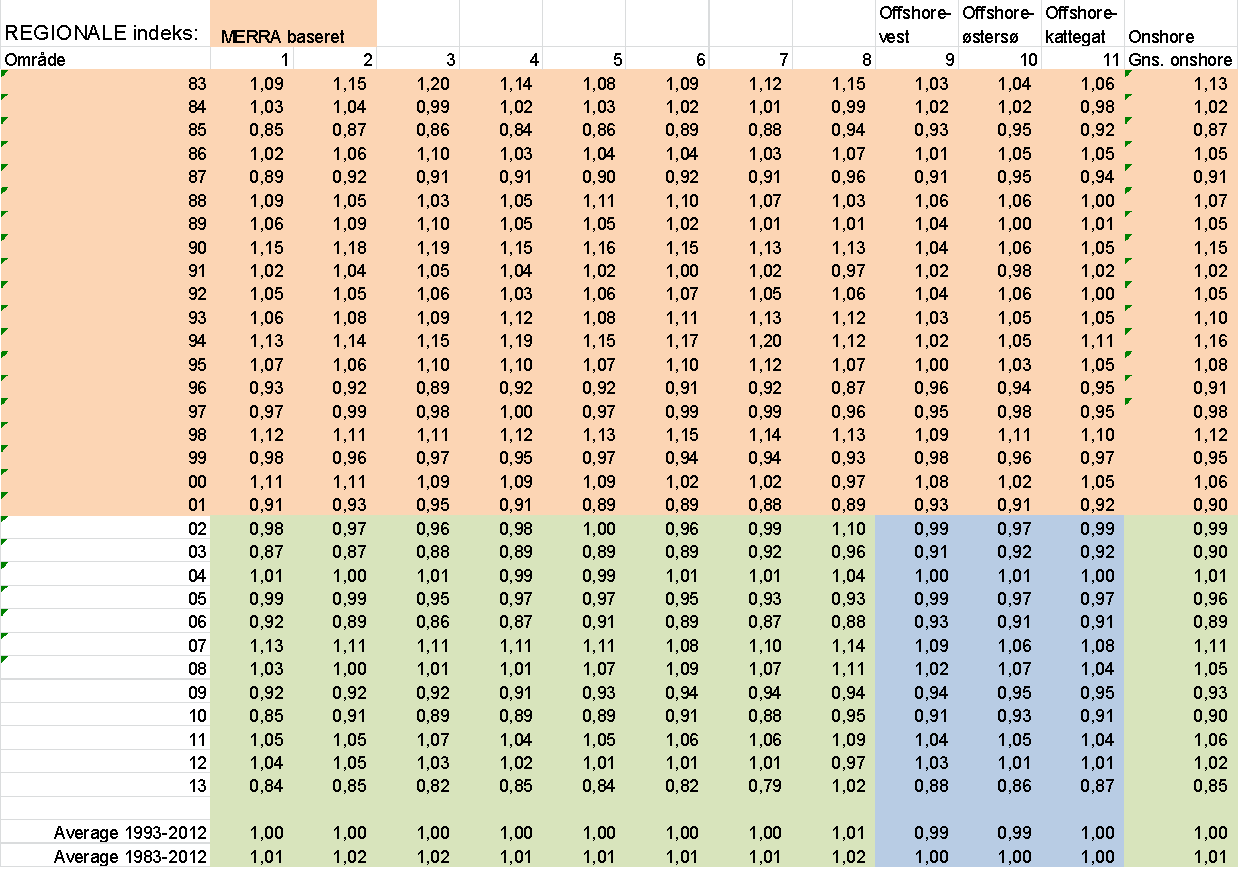
With this modification, we see a long term index close to 100% even on 30year basis ¢ remember the design criteria for the new index was 100% on recent 20y. The reason for not getting an exact match recent 20y of 1.00 for Bornholm (region 8) is some post adjustments due to cable connection problems, and for the offshore regions due to the way these are calculated(please see next paragraph).
Note that 2013 is here from January to September. The table is updated monthly and can be downloaded as an Excel sheet from www.vindstat.dk together with monthly regional turbine based indexes from 2002 and other relevant info about the Danish wind index.
Offshore wind index
For offshore locations, we have included an index for 3 regions, which must be considered as a ōguidelineö. The offshore index is based on onshore indexes from nearest regions, but modified with this formula:
Offshore index = 0.75*Onshore index + 0.25
This is based on experience data for a period, where we followed offshore projects closely. The formula gear down high wind months with 25% and gear up low wind months with 25%. The reason is the general higher wind speeds offshore, that makes the variations in energy production from low to high wind months much lower than onshore.
Why not use the offshore wind farm production for index? Partly because there are only 1-2 projects in each region, and we do not have production data for each turbine, only average of all in the wind farm. We therefore cannot filter decently on availability ¢ and the index would just be a self-fulfillment of the production of the offshore wind farms and thus not add any value.
The analyses of the onshore turbine based offshore indexes give the following results when we compare to pure model wind based indexes.
The 3 offshore regions with the onshore based constructed and the ōpureö model based indexes for the similar regions. Especially for region 10 (Nysted-R°dsand area), the correlation is very fine, probably mainly due to the close location to the coast.
For the other indexes, some deviations are noticed, but the major trends are captured. The main reason to have these offshore indexes is to present the expected long term production figures for all turbines in Denmark on monthly basis ¢ with only onshore indexes, these figures could be very wrong, especially as offshore now represents approx.1/3 of the total turbine production in Denmark.
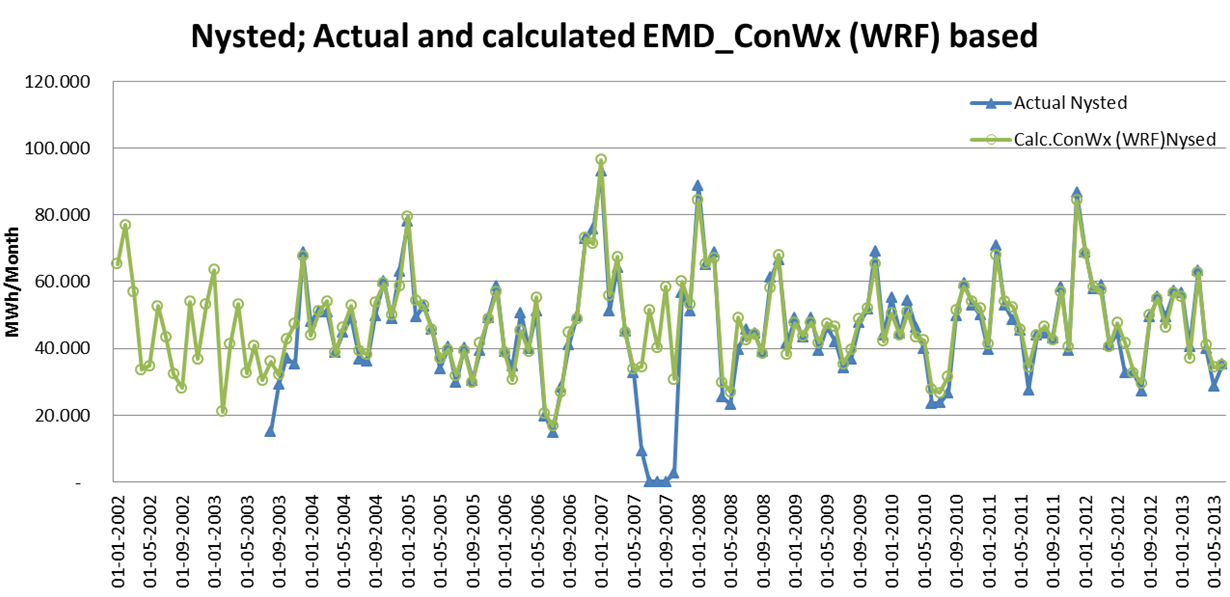
If a real comprehensive study on the long term expected production of the offshore wind farms should be made, we recommend setting up calculations on hourly basis, based on the EMD_ConWx meso scale model data.Our experience shows that this data set is very good in reproducing the actual turbine production on a monthly basis. See example for the Nysted wind farm below.
Above graph shows more than 10 years of actual production from Nysted wind farm compared to calculated production based on EMD_ConWx meso scale model wind data month by month.
The standard deviation on the ratio actual/calculated for the 10 years is just 1%!! when we take out the ramp up period and the period in 2007 when the wind farm was out of operation for almost 5 months due to tansformer breakdown.
Based on the above excellent result as well as other tests, we are natually considering to create an offshore index based on this method, which we anticipate will be able offer very precise offshore indexes.
This will require development of an automated process using EMD ConWx model data, which is based on ERA Interim data with a delay of 3 months from real time.
Kilder:
EMD’s danske vind energi indeks ver. 2020 benytter ERA5 data fra C3S. ERA5 data er udviklet og gjort tilgængelige igennem det EU finansierede Copernicus Climate Change Service (C3S) program. Data processering og distribuering af ERA5 er udført af ECMWF; viderebearbejdning og redistribuering via EMD’s windPRO og EMD-API. Læs mere: https://www.windpro.com og https://api.emd.dk.